
What human-centered market opportunities exist for low to medium cost air quality sensors in cities Oslo, Munich and San José?
The challenge
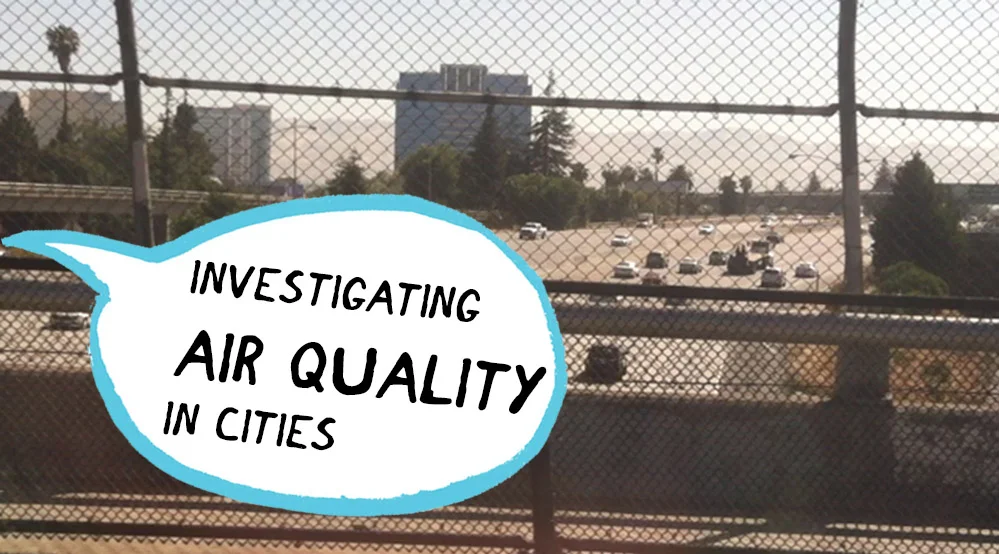
For our 3 month summer MSc Design Ethnography thesis project we (a team of 3) are tasked by a large tech company to investigate issues around air quality in our local cities. We are to conduct ethnographic research in our city, then collaborate remotely to compare and analyze findings to produce actionable insights.
Project story
To get started we established a strategy for working remotely together. Tasks and project roles were assigned according to the project plan / timeline on a shared calendar. One team member created a strong project brand which we used on all communications. In a previous project we took part in a “kindness based work” experiment which we elected to continue in this one (see working with kindness).
Desk Research
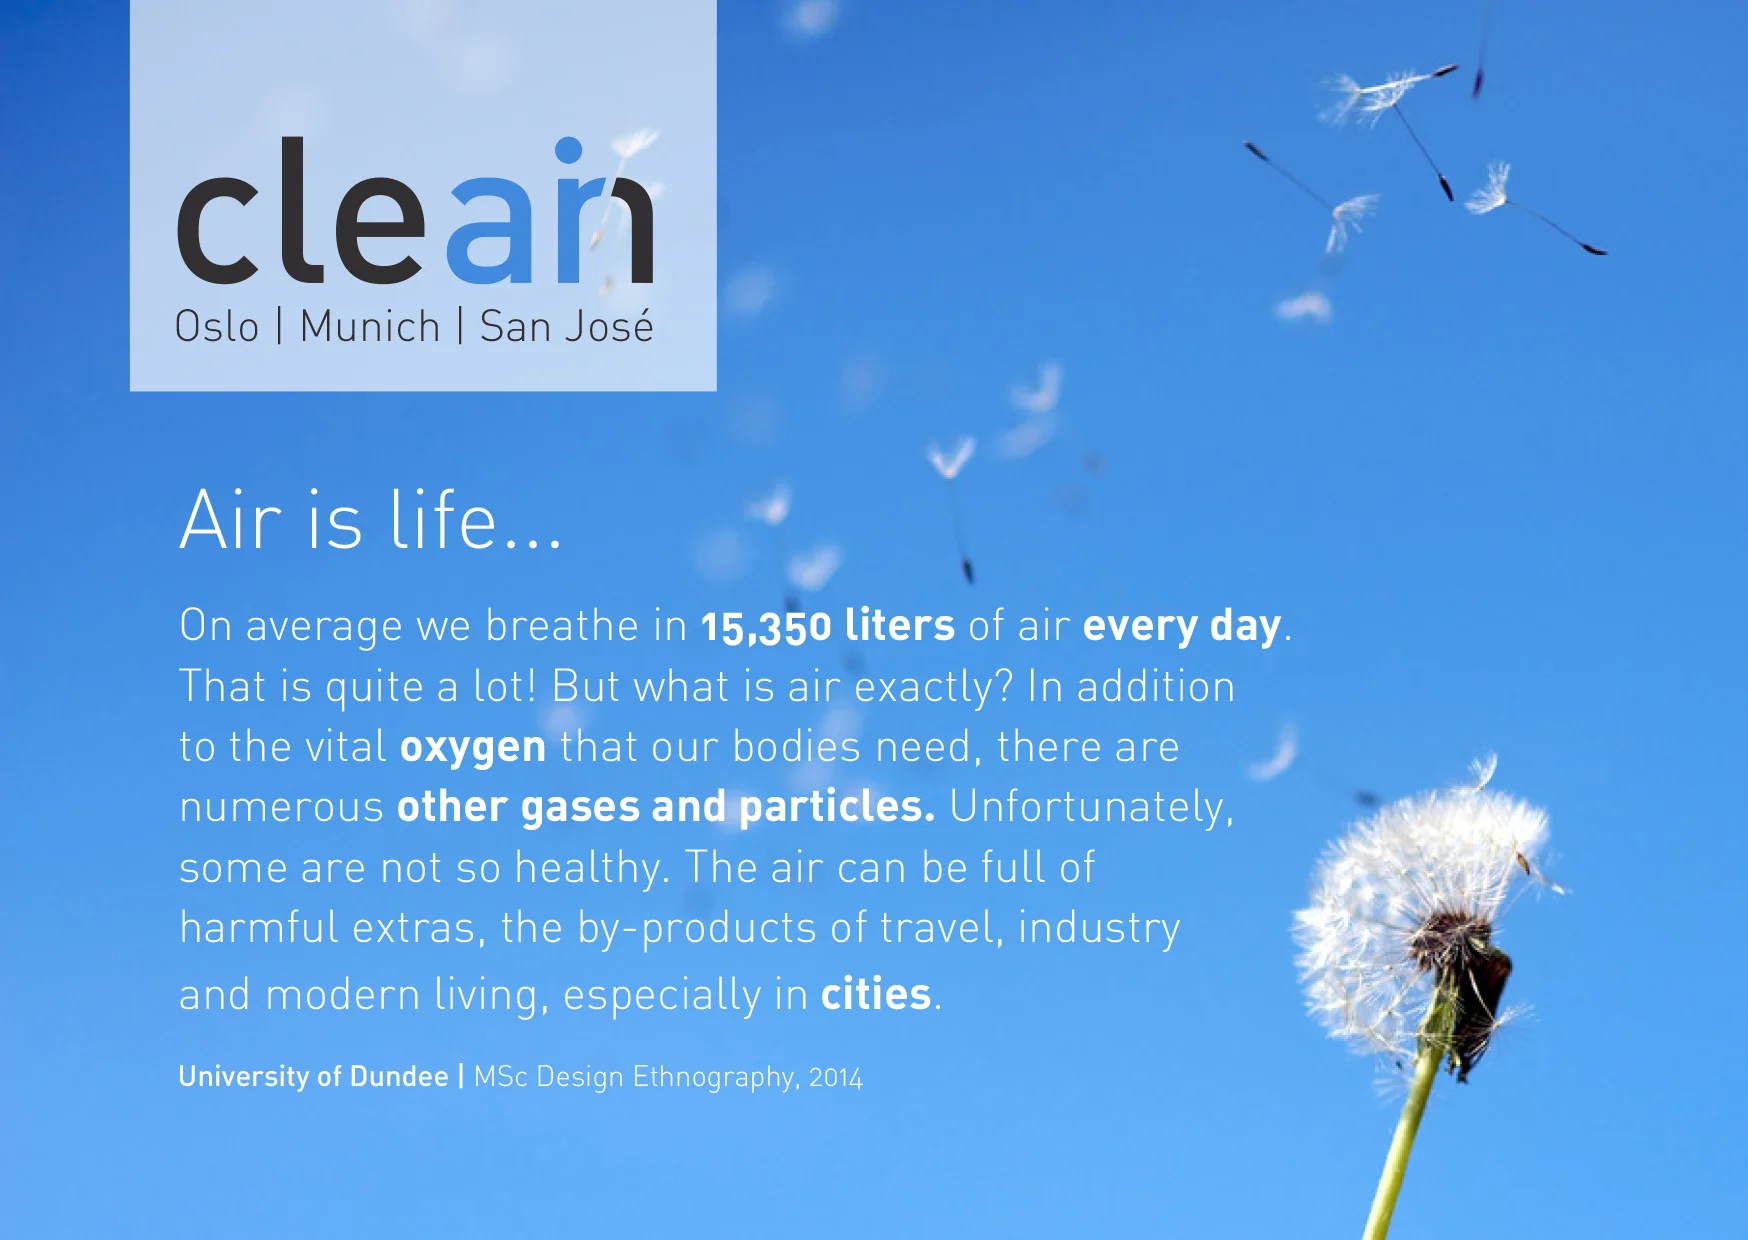
Secondary research was undertaken to discover and understand past, current and future issues related to air quality and relevant technologies: air sensor technology, the Internet of Things, Smart Cities, Big Data, and not forgetting us; human beings who have to live with the quality of air around us, and technologies chosen and imposed upon us. Learnings were presented as insights and design questions.
Recruiting
Starting with a common stakeholder map derived from the UN’s Urban Air Quality Management Toolbook, we identified local area stakeholders along a spectrum from government to single citizen. Each team member defined a recruitment strategy appropriate to their city. A few rounds of co-creating produced a selection of protocols for different types of people. These were continually adapted to suit each situation.
Talking to people
Getting out into the field required a different approach for each location. My strategy was to start with a field trip to San José to get a flavor of the city and ask people to answer a short questionnaire, then approach public and governmental figures for one-to-one interviews and build contacts from those conversations working towards individual citizens. A range of participants were eventually recruited, giving a comprehensive overview of air quality issues and perspectives.
Making sense of the data
Without a big white wall and a bunch of post-its to help us, we tried a few different approaches to remote sensemaking. Sessions involved sharing data via GoogleDocs and affinitizing on Mural.ly. Two sense making protocols were created to help us affinitize our data: “quick n’ dirty’ and ‘in-depth’. A third protocol involved metaphorical analysis to reveal feelings / exploring tensions on a matrix. From these we created maps of stakeholders and air quality issues showing the connections and relationships between them.
Telling the story
In general, we found that officials and activists are concerned with vehicle traffic as the main air quality problem in our three cities, but convenience culture and lack of awareness inhibit public buy-in. Citizen engagement became the main theme of our research. Our project journey and key findings are charted in a series of reports and an “ethno toolkit” detailing methods used and personal reflections. The final presentation tells the tale of each city, pulling out common air quality themes and barriers to behavior change that may have implications for sensor use. Using our findings, we each developed a prototype proposal addressing the unique issues of our city.
Recruitment flyer with project branding.
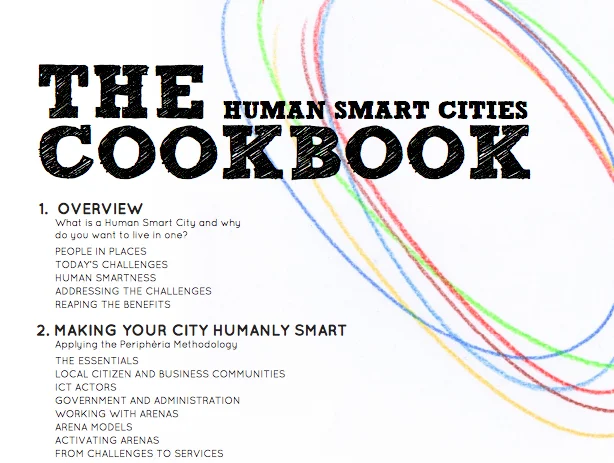
We were inspired by Periphéria's Human Smart City Cookbook.
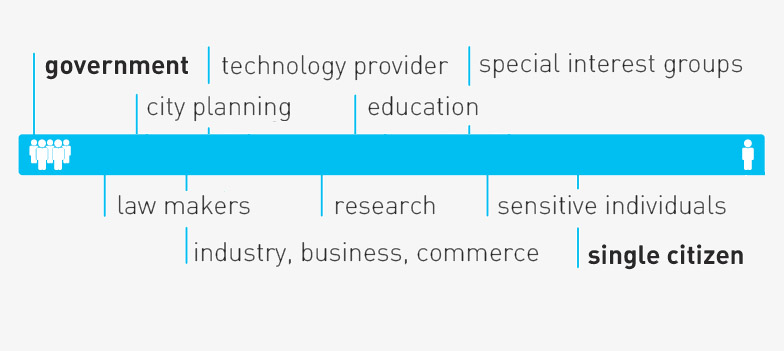
Our air quality stakeholder map, derived from the UN's Urban Air Quality Management Toolbook.
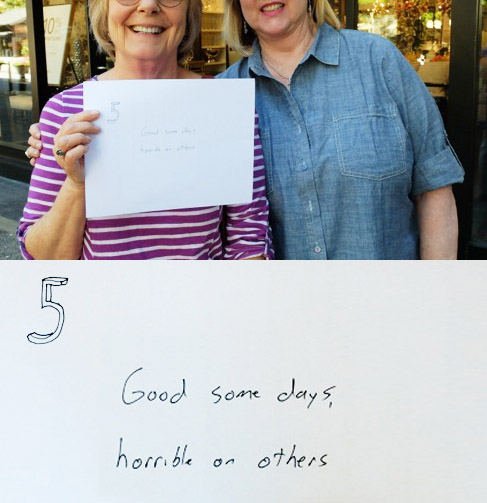
People on the street rated the air in San José from 1 to 10, with 10 the best.
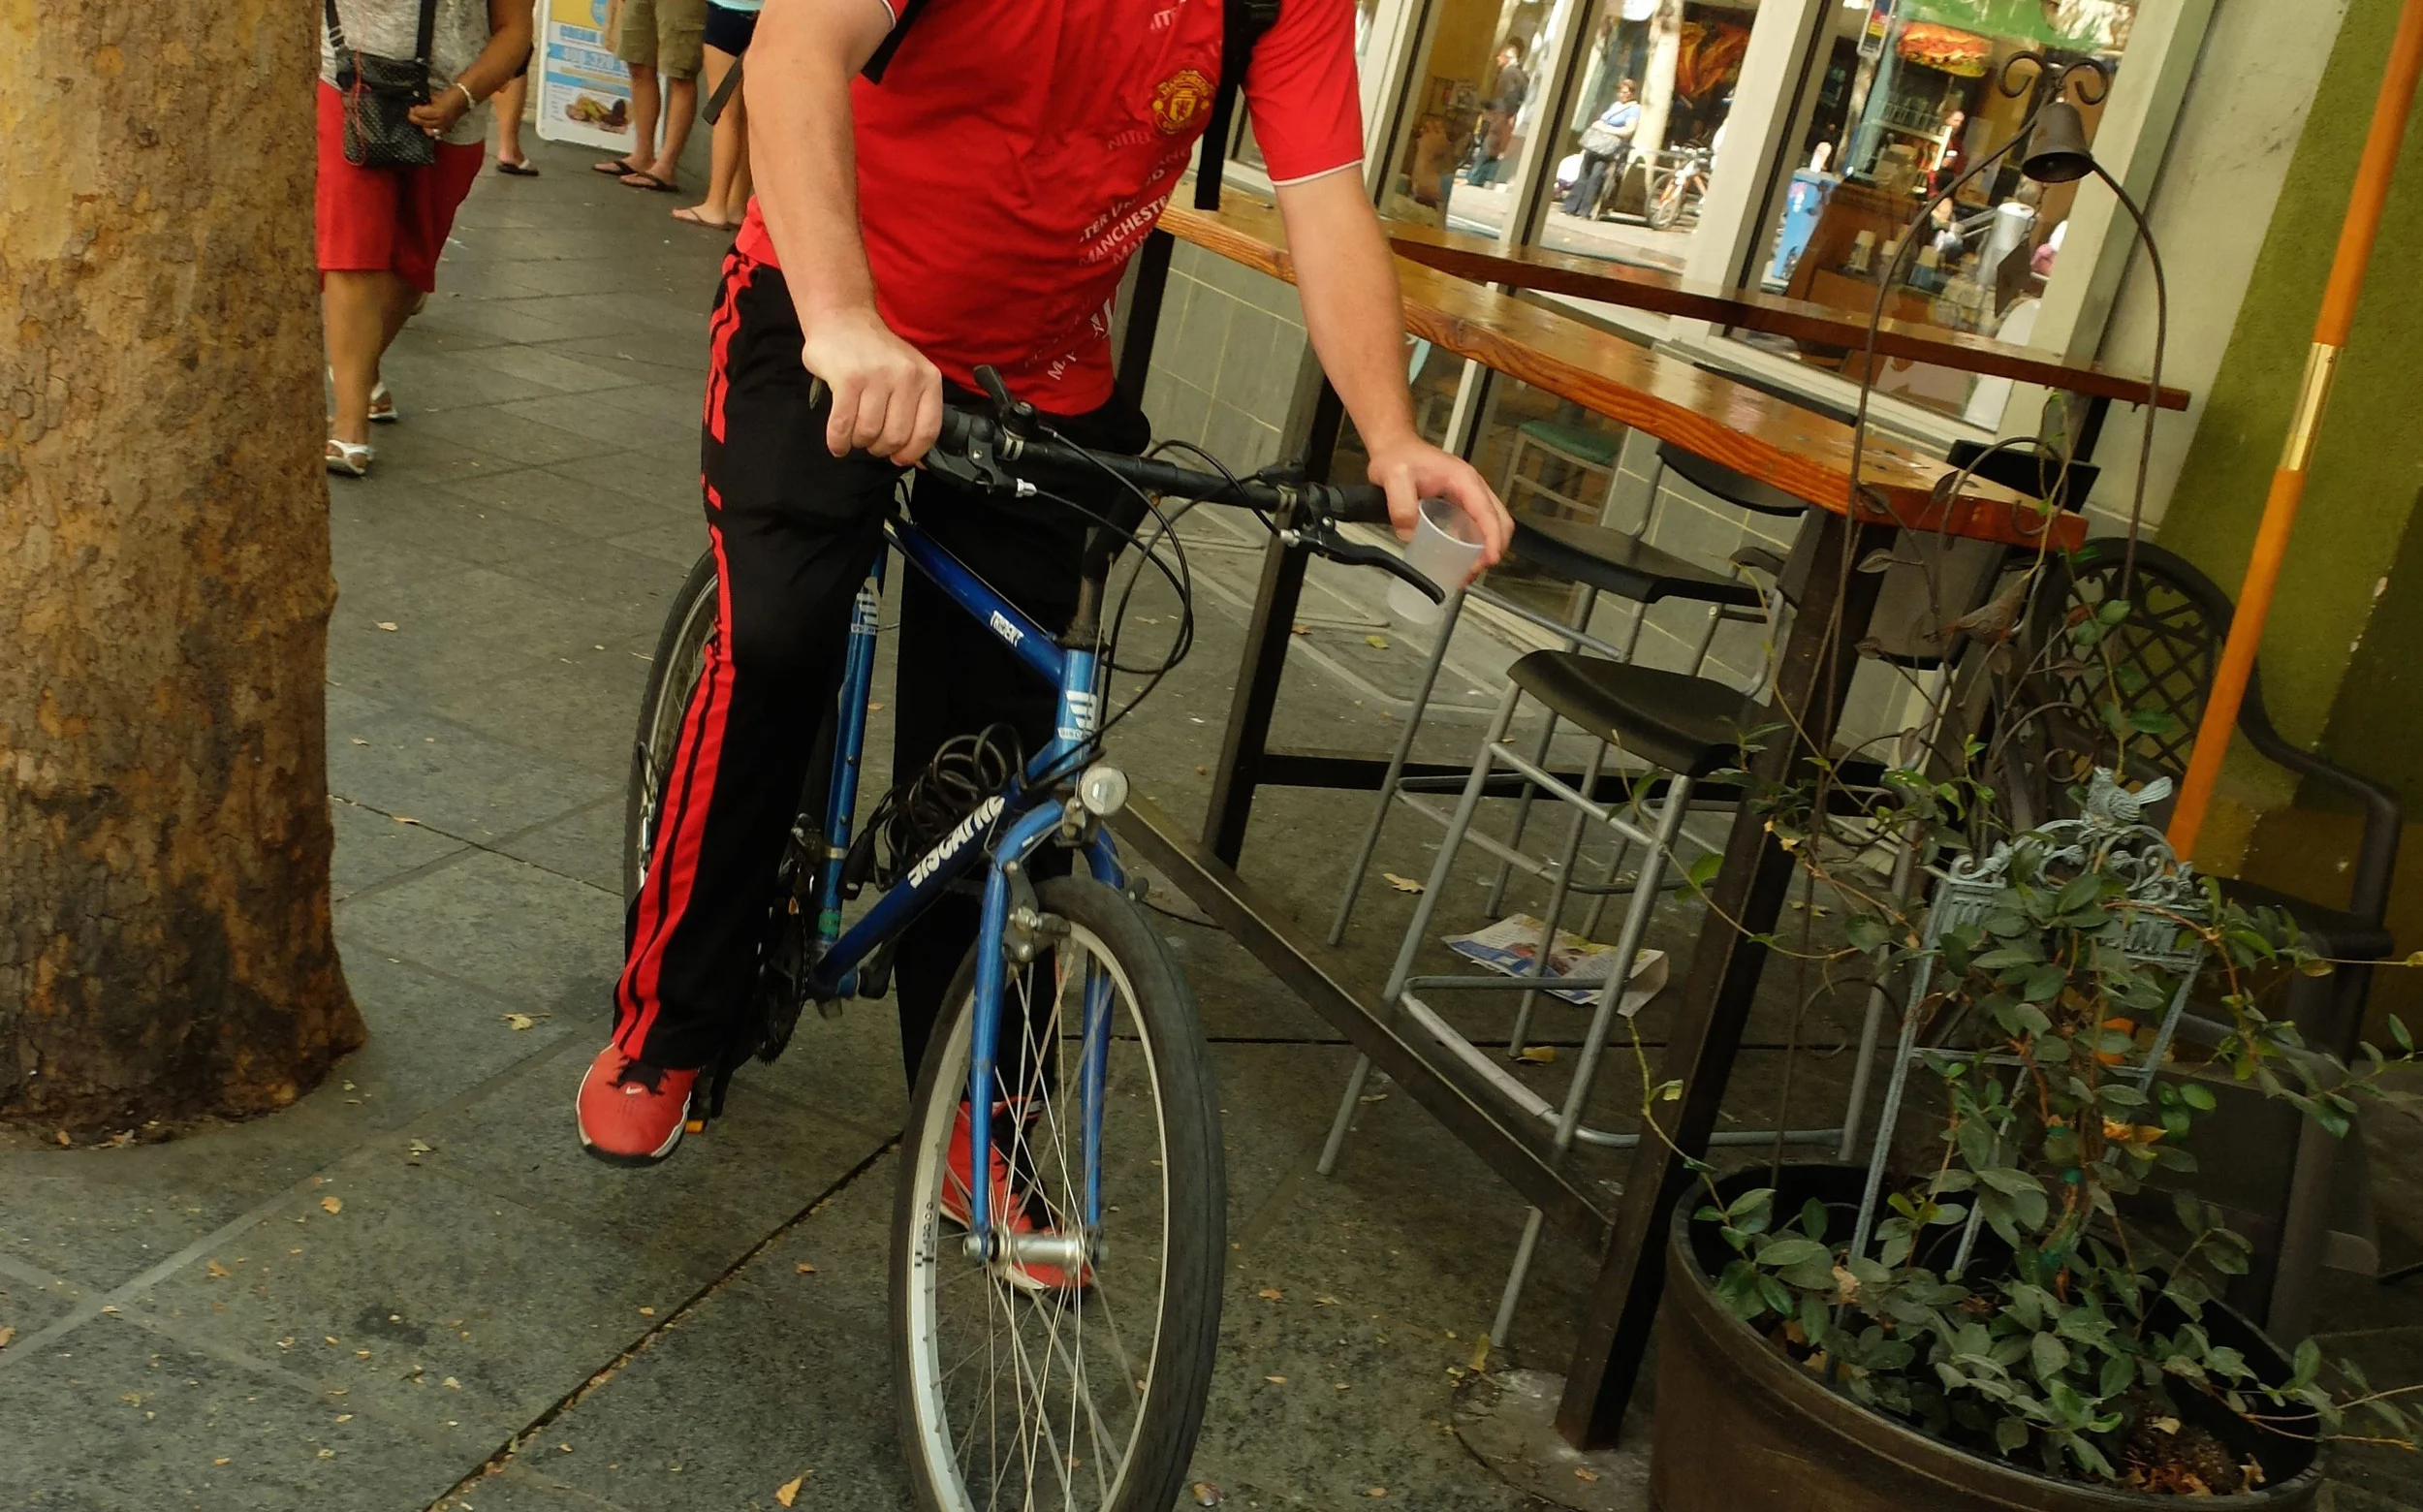
Many cyclists prefer to use the sidewalk as they don't feel safe on the road.
Issue maps help to make sense of the data.
Skills & learnings
Key learnings
Working on an intense project simultaneously in three separate locations required a high degree of organization and team cohesion. Daily meetings and cc’ing each other on all emails helped to limit confusion and keep us on the same page. However, if we could do things again, more time could be allocated to analysis as this took longer to do remotely. Our kindness based work experiment helped us get along and provided protocol when issues arose.
My contribution
We were a tight-knit and highly collaborative team and as such we managed without a designated project manager, instead meeting daily to review our timeline and assign tasks. I had a hand in planning and management, and being the only native English speaker, took the role of client point person / external communications and acted as editor for reports and presentations.